Module bn2graph
-
pyAgrum.lib.bn2graph.BN2dot(bn, size='4', nodeColor=None, arcWidth=None, arcColor=None, cmapNode=None, cmapArc=None, showMsg=None)¶ create a pydotplus representation of the BN
Parameters: - bn (pyAgrum.BayesNet) –
- size (string) – size of the rendered graph
- nodeColor – a nodeMap of values (between 0 and 1) to be shown as color of nodes (with special colors for 0 and 1)
- arcWidth – a arcMap of values to be shown as width of arcs
- arcColor – a arcMap of values (between 0 and 1) to be shown as color of arcs
- cmapNode – color map to show the vals of Nodes
- cmapArc – color map to show the vals of Arcs.
- showMsg – a nodeMap of values to be shown as tooltip
Returns: the desired representation of the BN as a dot graph
-
pyAgrum.lib.bn2graph.BNinference2dot(bn, size=None, engine=None, evs={}, targets={}, nodeColor=None, arcWidth=None, arcColor=None, cmapNode=None, cmapArc=None, dag=None)¶ create a pydotplus representation of an inference in a BN
Parameters: - bn (pyAgrum.BayesNet) –
- size (string) – size of the rendered graph
- Inference engine (pyAgrum) – inference algorithm used. If None, LazyPropagation will be used
- evs (dictionnary) – map of evidence
- targets (set) – set of targets. If targets={} then each node is a target
- nodeColor – a nodeMap of values to be shown as color nodes (with special color for 0 and 1)
- arcWidth – a arcMap of values to be shown as bold arcs
- arcColor – a arcMap of values (between 0 and 1) to be shown as color of arcs
- cmapNode – color map to show the vals of Nodes
- cmapArc – color map to show the vals of Arcs
:param dag : only shows nodes that have their id in the dag (and not in the whole BN)
Returns: the desired representation of the inference
-
pyAgrum.lib.bn2graph.dotize(aBN, name, format='pdf')¶ From a bn, creates an image of the BN
Parameters: - bn (pyAgrum.BayesNet) – the bayes net to show
- name (string) – the filename (without extension) for the image
- format (string) – format in [‘pdf’,’png’,’fig’,’jpg’,’svg’]
-
pyAgrum.lib.bn2graph.forDarkTheme()¶ change the color for arcs and text in graphs to be more visible in dark theme
-
pyAgrum.lib.bn2graph.forLightTheme()¶ change the color for arcs and text in graphs to be more visible in light theme
-
pyAgrum.lib.bn2graph.getBlackInTheme()¶ return the color used for arc and text in graphs
-
pyAgrum.lib.bn2graph.pdfize(aBN, name)¶ From a bn, creates a pdf of the BN
Parameters: - bn (pyAgrum.BayesNet) – the bayes net to show
- name (string) – the filename (without extension) for the image
-
pyAgrum.lib.bn2graph.pngize(aBN, name)¶ From a bn, creates a png of the BN
Parameters: - bn (pyAgrum.BayesNet) – the bayes net to show
- name (string) – the filename (without extension) for the image
-
pyAgrum.lib.bn2graph.proba2histo(p, scale=1.0)¶ compute the representation of an histogram for a mono-dim Potential
Parameters: p (pyAgrum.Potential) – the mono-dim Potential Returns: a matplotlib histogram for a Potential p.
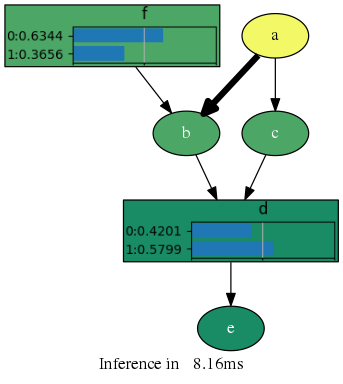
1 2 3 4 5 6 7 8 9 10 11 12 | bn = gum.fastBN("a->b->d;a->c->d->e;f->b")
g = BNinference2dot(bn,
targets=['f', 'd'],
vals={'a': 1,
'b': 0.3,
'c': 0.3,
'd': 0.1,
'e': 0.1,
'f': 0.3},
arcvals={(0, 1): 2,
(0, 2): 0.5})
g.write("test.png", format='png')
|
Visualization of Potentials
-
pyAgrum.lib.bn2graph.proba2histo(p, scale=1.0) compute the representation of an histogram for a mono-dim Potential
Parameters: p (pyAgrum.Potential) – the mono-dim Potential Returns: a matplotlib histogram for a Potential p.
Visualization of Bayesian Networks
-
pyAgrum.lib.bn2graph.BN2dot(bn, size='4', nodeColor=None, arcWidth=None, arcColor=None, cmapNode=None, cmapArc=None, showMsg=None) create a pydotplus representation of the BN
Parameters: - bn (pyAgrum.BayesNet) –
- size (string) – size of the rendered graph
- nodeColor – a nodeMap of values (between 0 and 1) to be shown as color of nodes (with special colors for 0 and 1)
- arcWidth – a arcMap of values to be shown as width of arcs
- arcColor – a arcMap of values (between 0 and 1) to be shown as color of arcs
- cmapNode – color map to show the vals of Nodes
- cmapArc – color map to show the vals of Arcs.
- showMsg – a nodeMap of values to be shown as tooltip
Returns: the desired representation of the BN as a dot graph
-
pyAgrum.lib.bn2graph.BNinference2dot(bn, size=None, engine=None, evs={}, targets={}, nodeColor=None, arcWidth=None, arcColor=None, cmapNode=None, cmapArc=None, dag=None) create a pydotplus representation of an inference in a BN
Parameters: - bn (pyAgrum.BayesNet) –
- size (string) – size of the rendered graph
- Inference engine (pyAgrum) – inference algorithm used. If None, LazyPropagation will be used
- evs (dictionnary) – map of evidence
- targets (set) – set of targets. If targets={} then each node is a target
- nodeColor – a nodeMap of values to be shown as color nodes (with special color for 0 and 1)
- arcWidth – a arcMap of values to be shown as bold arcs
- arcColor – a arcMap of values (between 0 and 1) to be shown as color of arcs
- cmapNode – color map to show the vals of Nodes
- cmapArc – color map to show the vals of Arcs
:param dag : only shows nodes that have their id in the dag (and not in the whole BN)
Returns: the desired representation of the inference
Hi-level functions
-
pyAgrum.lib.bn2graph.dotize(aBN, name, format='pdf') From a bn, creates an image of the BN
Parameters: - bn (pyAgrum.BayesNet) – the bayes net to show
- name (string) – the filename (without extension) for the image
- format (string) – format in [‘pdf’,’png’,’fig’,’jpg’,’svg’]
-
pyAgrum.lib.bn2graph.pngize(aBN, name) From a bn, creates a png of the BN
Parameters: - bn (pyAgrum.BayesNet) – the bayes net to show
- name (string) – the filename (without extension) for the image
-
pyAgrum.lib.bn2graph.pdfize(aBN, name) From a bn, creates a pdf of the BN
Parameters: - bn (pyAgrum.BayesNet) – the bayes net to show
- name (string) – the filename (without extension) for the image