Module bn2graph
A module to graphically display Bayesian networks using pydotplus (and then graphviz).
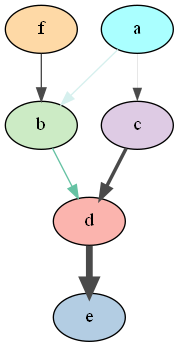
1 2 3 4 5 6 7 8 9 10 11 12 13 14 15 16 17 18 | import pyAgrum as gum
from pyAgrum.lib.bn2graph import BN2dot
bn = gum.fastBN("a->b->d;a->c->d[3]->e;f->b")
g = BN2dot(bn,
nodeColor={'a': 1,
'b': 0.3,
'c': 0.4,
'd': 0.1,
'e': 0.2,
'f': 0.5},
arcColor={(0, 1): 0.2,
(1, 2): 0.5},
arcWidth={(0, 3): 0.4,
(3, 2): 0.5,
(2,4) :0.6})
g.write("bn2graph_test.png", format='png')
|
Visualization of Potentials
-
pyAgrum.lib.bn2graph.proba2histo(p, scale=1.0, util=None, txtcolor='Black')¶ compute the representation of an histogram for a mono-dim Potential
Parameters: - p (pyAgrum.Potential) – the mono-dimensional Potential
- util (pyAgrum.Potential) – an (optional) secondary Potential (values in labels)
- txtcolor (str) – color for text
Returns: a matplotlib histogram for a Potential p.
Return type: matplotlib.Figure
Visualization of Bayesian networks
-
pyAgrum.lib.bn2graph.BN2dot(bn, size=None, nodeColor=None, arcWidth=None, arcColor=None, cmapNode=None, cmapArc=None, showMsg=None)¶ create a pydotplus representation of the BN
Parameters: - bn (pyAgrum.BayesNet) – the Bayesian network
- size (str) – size of the rendered graph
- nodeColor (dict) – a nodeMap of values to be shown as color nodes (with special color for 0 and 1)
- arcWidth (dict) – a arcMap of values to be shown as bold arcs
- arcColor (dict) – a arcMap of values (between 0 and 1) to be shown as color of arcs
- cmapNode (ColorMap) – color map to show the vals of Nodes
- cmapArc (ColorMap) – color map to show the vals of Arcs
- dag (pyAgrum.DAG) – only shows nodes that have their id in the dag (and not in the whole BN)
- showMsg (dict) – a nodeMap of values to be shown as tooltip
Returns: Return type: the desired representation of the Bayesian network
-
pyAgrum.lib.bn2graph.BNinference2dot(bn, size=None, engine=None, evs={}, targets={}, nodeColor=None, arcWidth=None, arcColor=None, cmapNode=None, cmapArc=None, dag=None)¶ create a pydotplus representation of an inference in a BN
Parameters: - bn (pyAgrum.BayesNet) – the Bayesian network
- size (str) – size of the rendered graph
- engine (pyAgrum.Inference) – inference algorithm used. If None, LazyPropagation will be used
- evs (dict) – map of evidence
- targets (set) – set of targets. If targets={} then each node is a target
- nodeColor (dict) – a nodeMap of values to be shown as color nodes (with special color for 0 and 1)
- arcWidth (dict) – a arcMap of values to be shown as bold arcs
- arcColor (dict) – a arcMap of values (between 0 and 1) to be shown as color of arcs
- cmapNode (ColorMap) – color map to show the vals of Nodes
- cmapArc (ColorMap) – color map to show the vals of Arcs
- dag (pyAgrum.DAG) – only shows nodes that have their id in the dag (and not in the whole BN)
Returns: Return type: the desired representation of the inference
Hi-level functions
-
pyAgrum.lib.bn2graph.dotize(aBN, name, format='pdf')¶ From a bn, creates an image of the BN
Parameters: - bn (pyAgrum.BayesNet) – the bayes net to show
- name (string) – the filename (without extension) for the image
- format (string) – format in [‘pdf’,’png’,’fig’,’jpg’,’svg’]
-
pyAgrum.lib.bn2graph.pngize(aBN, name)¶ From a bn, creates a png of the BN
Parameters: - bn (pyAgrum.BayesNet) – the bayes net to show
- name (string) – the filename (without extension) for the image
-
pyAgrum.lib.bn2graph.pdfize(aBN, name)¶ From a bn, creates a pdf of the BN
Parameters: - bn (pyAgrum.BayesNet) – the bayes net to show
- name (string) – the filename (without extension) for the image