pyAgrum.lib.explain
The purpose of pyAgrum.lib.explain is to give tools to explain and interpret the structure and parameters of a Bayesian network.
Dealing with independence
- pyAgrum.lib.explain.independenceListForPairs(bn, filename, target=None, plot=True, alphabetic=False)
get the p-values of the chi2 test of a (as simple as possible) independence proposition for every non arc.
- Parameters:
bn (gum.BayesNet) – the Bayesian network
filename (str) – the name of the csv database
alphabetic (bool) – if True, the list is alphabetically sorted else it is sorted by the p-value
target ((optional) str or int) – the name or id of the target variable
plot (bool) – if True, plot the result
- Returns:
the list
Dealing with mutual information and entropy
- pyAgrum.lib.explain.getInformation(bn, evs=None, size=None, cmap=<matplotlib.colors.LinearSegmentedColormap object>)
get a HTML string for a bn annotated with results from inference : entropy and mutual information
- Parameters:
bn (pyAgrum.BayesNet) – the model
evs (Dict[str|int,str|int|List[float]]) – the observations
size (int|str) – size of the rendered graph
cmap (matplotlib.colours.Colormap) – the cmap
- Returns:
return the HTML string
- Return type:
str
- pyAgrum.lib.explain.showInformation(bn, evs=None, size=None, cmap=<matplotlib.colors.LinearSegmentedColormap object>)
diplay a bn annotated with results from inference : entropy and mutual information
- Parameters:
bn (pyAgrum.BayesNet) – the model
evs (Dict[str|int,str|int|List[float]]) – the observations
size (int|str) – size of the rendered graph
cmap (matplotlib.colours.Colormap) – the cmap
Dealing with ShapValues
- class pyAgrum.lib.explain.ShapValues(bn, target)
Bases:
objectThe ShapValue class implements the calculation of Shap values in Bayesian networks.
The main implementation is based on Conditional Shap values [3], but the Interventional calculation method proposed in [2] is also present. In addition, a new causal method, based on [1], is implemented which is well suited for Bayesian networks.
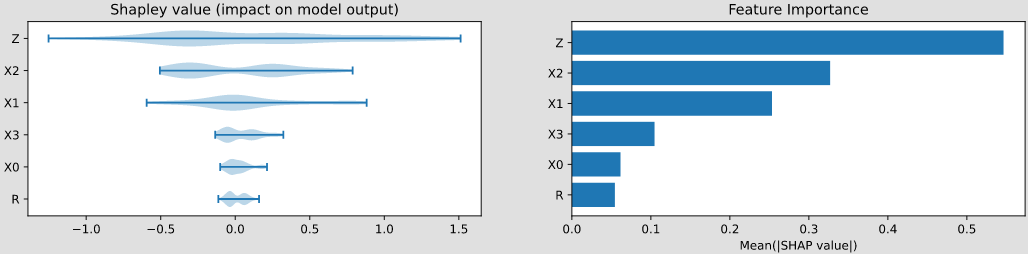
- causal(train, plot=False, plot_importance=False, percentage=False)
Compute the causal Shap Values for each variables.
- Parameters:
train (pandas.DataFrame) – the database
plot (bool) – if True, plot the violin graph of the shap values
plot_importance (bool) – if True, plot the importance plot
percentage (bool) – if True, the importance plot is shown in percent.
- Returns:
a dictionary Dict[str,float]
- conditional(train, plot=False, plot_importance=False, percentage=False)
Compute the conditional Shap Values for each variables.
- Parameters:
train (pandas.DataFrame) – the database
plot (bool) – if True, plot the violin graph of the shap values
plot_importance (bool) – if True, plot the importance plot
percentage (bool) – if True, the importance plot is shown in percent.
- Returns:
a dictionary Dict[str,float]
- marginal(train, sample_size=200, plot=False, plot_importance=False, percentage=False)
Compute the marginal Shap Values for each variables.
- Parameters:
train (pandas.DataFrame) – the database
sample_size (int) – The computation of marginal ShapValue is very slow. The parameter allow to compute only on a fragment of the database.
plot (bool) – if True, plot the violin graph of the shap values
plot_importance (bool) – if True, plot the importance plot
percentage (bool) – if True, the importance plot is shown in percent.
- Returns:
a dictionary Dict[str,float]
- showShapValues(results, cmap='plasma')
- Parameters:
results (dict[str,float]) – The (Shap) values associates to each variable
cmap (Matplotlib.ColorMap) – The colormap used for colouring the nodes
- Returns:
a pydot.graph