Sensitivity analysis for Bayesian networks using credal networks

Creative Commons License

aGrUM

interactive online version

There are several sensitivity analysis frameworks for Bayesian networks. A fairly efficient method is certainly to use credal networks to do this analysis.

Creating a Bayesian network

In [1]:
import pyagrum as gum
import pyagrum.lib.notebook as gnb
In [2]:
bn = gum.fastBN("A->B->C<-D->E->F<-B")
gnb.flow.row(bn, gnb.getInference(bn))
Out[2]:
G E E F F E->F D D D->E C C D->C A A B B A->B B->F B->C
structs Inference in   0.64ms A 2026-08-18T12:00:01.761540 image/svg+xml Matplotlib v3.11.1, https://matplotlib.org/ B 2026-08-18T12:00:01.832106 image/svg+xml Matplotlib v3.11.1, https://matplotlib.org/ A->B C 2026-08-18T12:00:01.869907 image/svg+xml Matplotlib v3.11.1, https://matplotlib.org/ B->C F 2026-08-18T12:00:01.946014 image/svg+xml Matplotlib v3.11.1, https://matplotlib.org/ B->F D 2026-08-18T12:00:01.891816 image/svg+xml Matplotlib v3.11.1, https://matplotlib.org/ D->C E 2026-08-18T12:00:01.920061 image/svg+xml Matplotlib v3.11.1, https://matplotlib.org/ D->E E->F

Building a credal network from a BN

It is easy to build a credal network from a Bayesian network by indicating the ‘noise’ on each parameter.

In [3]:
cr = gum.CredalNet(bn, bn)
gnb.show(cr)
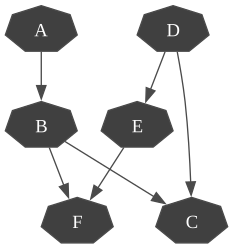
../_images/notebooks_14-Examples_SensitivityAnalysisUsingCredalNetworks_6_0.svg
In [4]:
cr.bnToCredal(1e-10, False, False)
In [5]:
cr.computeBinaryCPTMinMax()
In [6]:
print(cr)

A:Range([0,1])
<> : [[0.55286 , 0.44714] , [0.552821 , 0.447179]]

B:Range([0,1])
<A:0> : [[0.403363 , 0.596637] , [0.402953 , 0.597047]]
<A:1> : [[0.55775 , 0.44225] , [0.557714 , 0.442286]]

C:Range([0,1])
<B:0|D:0> : [[0.189192 , 0.810808] , [0.102062 , 0.897938]]
<B:1|D:0> : [[0.481363 , 0.518637] , [0.0182525 , 0.981748]]
<B:0|D:1> : [[0.526098 , 0.473902] , [0.526039 , 0.473961]]
<B:1|D:1> : [[0.37199 , 0.62801] , [0.371297 , 0.628703]]

D:Range([0,1])
<> : [[0.185717 , 0.814283] , [0.149711 , 0.850289]]

E:Range([0,1])
<D:0> : [[0.699161 , 0.300839] , [0.699156 , 0.300844]]
<D:1> : [[0.710072 , 0.289928] , [0.00449306 , 0.995507]]

F:Range([0,1])
<E:0|B:0> : [[0.659403 , 0.340597] , [0.659394 , 0.340606]]
<E:1|B:0> : [[0.490903 , 0.509097] , [0.490801 , 0.509199]]
<E:0|B:1> : [[0.237246 , 0.762754] , [0.228863 , 0.771137]]
<E:1|B:1> : [[0.36149 , 0.63851] , [0.360662 , 0.639338]]


Testing difference hypothesis about the global precision on the parameters

We can therefore easily conduct a sensitivity analysis based on an assumption of error on all the parameters of the network.

In [7]:
def showNoisy(bn, beta):
  cr = gum.CredalNet(bn, bn)
  cr.bnToCredal(beta, False, False)
  cr.computeBinaryCPTMinMax()
  ielbp = gum.CNLoopyPropagation(cr)
  return gnb.getInference(cr, engine=ielbp)
In [8]:
for eps in [1, 1e-1, 1e-2, 1e-3, 1e-10]:
  gnb.flow.add(showNoisy(bn, eps), caption=f"noise={eps}")
gnb.flow.display()
G E E F F E->F D D D->E C C D->C A A B B A->B B->F B->C
structs Inference in   0.64ms A 2026-08-18T12:00:01.761540 image/svg+xml Matplotlib v3.11.1, https://matplotlib.org/ B 2026-08-18T12:00:01.832106 image/svg+xml Matplotlib v3.11.1, https://matplotlib.org/ A->B C 2026-08-18T12:00:01.869907 image/svg+xml Matplotlib v3.11.1, https://matplotlib.org/ B->C F 2026-08-18T12:00:01.946014 image/svg+xml Matplotlib v3.11.1, https://matplotlib.org/ B->F D 2026-08-18T12:00:01.891816 image/svg+xml Matplotlib v3.11.1, https://matplotlib.org/ D->C E 2026-08-18T12:00:01.920061 image/svg+xml Matplotlib v3.11.1, https://matplotlib.org/ D->E E->F
structs Inference in   0.61ms A 2026-08-18T12:00:02.868751 image/svg+xml Matplotlib v3.11.1, https://matplotlib.org/ B 2026-08-18T12:00:02.894629 image/svg+xml Matplotlib v3.11.1, https://matplotlib.org/ A->B C 2026-08-18T12:00:02.930559 image/svg+xml Matplotlib v3.11.1, https://matplotlib.org/ B->C F 2026-08-18T12:00:03.011769 image/svg+xml Matplotlib v3.11.1, https://matplotlib.org/ B->F D 2026-08-18T12:00:02.954184 image/svg+xml Matplotlib v3.11.1, https://matplotlib.org/ D->C E 2026-08-18T12:00:02.976329 image/svg+xml Matplotlib v3.11.1, https://matplotlib.org/ D->E E->F
noise=1
structs Inference in   0.24ms A 2026-08-18T12:00:03.304714 image/svg+xml Matplotlib v3.11.1, https://matplotlib.org/ B 2026-08-18T12:00:03.342344 image/svg+xml Matplotlib v3.11.1, https://matplotlib.org/ A->B C 2026-08-18T12:00:03.375207 image/svg+xml Matplotlib v3.11.1, https://matplotlib.org/ B->C F 2026-08-18T12:00:03.463705 image/svg+xml Matplotlib v3.11.1, https://matplotlib.org/ B->F D 2026-08-18T12:00:03.407527 image/svg+xml Matplotlib v3.11.1, https://matplotlib.org/ D->C E 2026-08-18T12:00:03.429766 image/svg+xml Matplotlib v3.11.1, https://matplotlib.org/ D->E E->F
noise=0.1
structs Inference in   0.87ms A 2026-08-18T12:00:03.714151 image/svg+xml Matplotlib v3.11.1, https://matplotlib.org/ B 2026-08-18T12:00:03.750912 image/svg+xml Matplotlib v3.11.1, https://matplotlib.org/ A->B C 2026-08-18T12:00:03.779536 image/svg+xml Matplotlib v3.11.1, https://matplotlib.org/ B->C F 2026-08-18T12:00:03.888411 image/svg+xml Matplotlib v3.11.1, https://matplotlib.org/ B->F D 2026-08-18T12:00:03.812959 image/svg+xml Matplotlib v3.11.1, https://matplotlib.org/ D->C E 2026-08-18T12:00:03.851139 image/svg+xml Matplotlib v3.11.1, https://matplotlib.org/ D->E E->F
noise=0.01
structs Inference in   0.27ms A 2026-08-18T12:00:04.193980 image/svg+xml Matplotlib v3.11.1, https://matplotlib.org/ B 2026-08-18T12:00:04.229010 image/svg+xml Matplotlib v3.11.1, https://matplotlib.org/ A->B C 2026-08-18T12:00:04.251502 image/svg+xml Matplotlib v3.11.1, https://matplotlib.org/ B->C F 2026-08-18T12:00:04.358747 image/svg+xml Matplotlib v3.11.1, https://matplotlib.org/ B->F D 2026-08-18T12:00:04.290394 image/svg+xml Matplotlib v3.11.1, https://matplotlib.org/ D->C E 2026-08-18T12:00:04.321995 image/svg+xml Matplotlib v3.11.1, https://matplotlib.org/ D->E E->F
noise=0.001
structs Inference in   0.82ms A 2026-08-18T12:00:04.676006 image/svg+xml Matplotlib v3.11.1, https://matplotlib.org/ B 2026-08-18T12:00:04.697593 image/svg+xml Matplotlib v3.11.1, https://matplotlib.org/ A->B C 2026-08-18T12:00:04.724719 image/svg+xml Matplotlib v3.11.1, https://matplotlib.org/ B->C F 2026-08-18T12:00:04.818069 image/svg+xml Matplotlib v3.11.1, https://matplotlib.org/ B->F D 2026-08-18T12:00:04.754439 image/svg+xml Matplotlib v3.11.1, https://matplotlib.org/ D->C E 2026-08-18T12:00:04.777704 image/svg+xml Matplotlib v3.11.1, https://matplotlib.org/ D->E E->F
noise=1e-10
In [ ]:
