Influence Diagram and LIMIDS
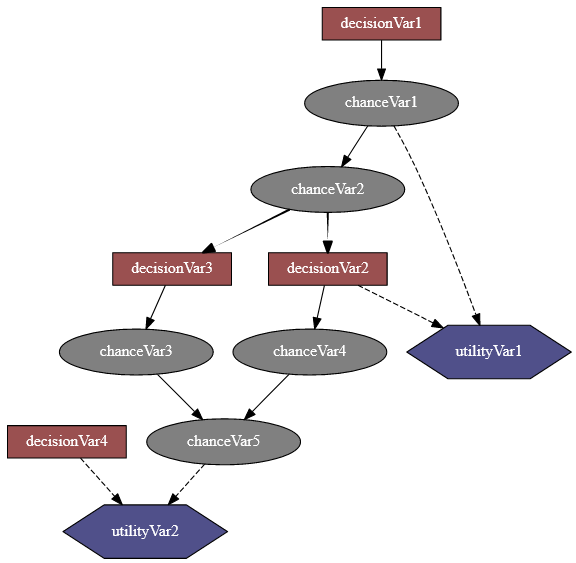
An influence diagram is a compact graphical and mathematical representation of a decision situation. It is a generalization of a Bayesian network, in which not only probabilistic inference problems but also decision making problems (following the maximum expected utility criterion) can be modeled and solved. It includes 3 types of nodes: chance, decision and utility nodes (from wikipedia).
PyAgrum’s so-called influence diagram represents both influence diagrams and LIMIDs. The way to enforce that such a model represent an influence diagram and not a LIMID belongs to the inference engine.
Tutorial
Input / Output
Influence diagrams can be saved and loaded using the native JGUM / BGUM Format Reference (recommended) or the BIFXML format.
import pyagrum as gum

id_ = gum.fastID("A->C->*D->$U;A->$U")
gum.saveID(id_, "model.jgum")   # jgum (JSON)
gum.saveID(id_, "model.bgum")   # bgum (binary)
id2 = gum.loadID("model.jgum")
Reference
- Model for Decision in PGM
InfluenceDiagramInfluenceDiagram.add()InfluenceDiagram.addArc()InfluenceDiagram.addArcs()InfluenceDiagram.addChanceNode()InfluenceDiagram.addDecisionNode()InfluenceDiagram.addStructureListener()InfluenceDiagram.addUtilityNode()InfluenceDiagram.addVariables()InfluenceDiagram.adjacencyMatrix()InfluenceDiagram.ancestors()InfluenceDiagram.arcs()InfluenceDiagram.beginTopologyTransformation()InfluenceDiagram.chanceNodeSize()InfluenceDiagram.changeVariableName()InfluenceDiagram.children()InfluenceDiagram.clear()InfluenceDiagram.completeInstantiation()InfluenceDiagram.connectedComponents()InfluenceDiagram.connectedComponentsCount()InfluenceDiagram.connectedComponentsList()InfluenceDiagram.cpt()InfluenceDiagram.dag()InfluenceDiagram.decisionNodeSize()InfluenceDiagram.decisionOrder()InfluenceDiagram.decisionOrderExists()InfluenceDiagram.descendants()InfluenceDiagram.empty()InfluenceDiagram.endTopologyTransformation()InfluenceDiagram.erase()InfluenceDiagram.eraseArc()InfluenceDiagram.exists()InfluenceDiagram.existsArc()InfluenceDiagram.existsPathBetween()InfluenceDiagram.existsProperty()InfluenceDiagram.family()InfluenceDiagram.fastPrototype()InfluenceDiagram.getDecisionGraph()InfluenceDiagram.hasSameStructure()InfluenceDiagram.idFromName()InfluenceDiagram.ids()InfluenceDiagram.isChanceNode()InfluenceDiagram.isDecisionNode()InfluenceDiagram.isIndependent()InfluenceDiagram.isUtilityNode()InfluenceDiagram.loadBIFXML()InfluenceDiagram.loadGUM()InfluenceDiagram.loadGUMstring()InfluenceDiagram.log10DomainSize()InfluenceDiagram.minimalCondSet()InfluenceDiagram.moralGraph()InfluenceDiagram.moralizedAncestralGraph()InfluenceDiagram.names()InfluenceDiagram.nodeId()InfluenceDiagram.nodes()InfluenceDiagram.nodeset()InfluenceDiagram.parents()InfluenceDiagram.properties()InfluenceDiagram.saveBIFXML()InfluenceDiagram.saveGUM()InfluenceDiagram.saveGUMstring()InfluenceDiagram.size()InfluenceDiagram.sizeArcs()InfluenceDiagram.spaceCplxToString()InfluenceDiagram.thisownInfluenceDiagram.toDot()InfluenceDiagram.toFast()InfluenceDiagram.topologicalOrder()InfluenceDiagram.updateMetaData()InfluenceDiagram.utility()InfluenceDiagram.utilityNodeSize()InfluenceDiagram.variable()InfluenceDiagram.variableFromName()InfluenceDiagram.variableNodeMap()InfluenceDiagram.variables()
- Inference for Influence Diagram
ShaferShenoyLIMIDInferenceShaferShenoyLIMIDInference.MEU()ShaferShenoyLIMIDInference.addEvidence()ShaferShenoyLIMIDInference.addNoForgettingAssumption()ShaferShenoyLIMIDInference.chgEvidence()ShaferShenoyLIMIDInference.clear()ShaferShenoyLIMIDInference.eraseAllEvidence()ShaferShenoyLIMIDInference.eraseEvidence()ShaferShenoyLIMIDInference.hardEvidenceNodes()ShaferShenoyLIMIDInference.hasEvidence()ShaferShenoyLIMIDInference.hasHardEvidence()ShaferShenoyLIMIDInference.hasNoForgettingAssumption()ShaferShenoyLIMIDInference.hasSoftEvidence()ShaferShenoyLIMIDInference.influenceDiagram()ShaferShenoyLIMIDInference.isSolvable()ShaferShenoyLIMIDInference.junctionTree()ShaferShenoyLIMIDInference.makeInference()ShaferShenoyLIMIDInference.meanVar()ShaferShenoyLIMIDInference.nbrEvidence()ShaferShenoyLIMIDInference.nbrHardEvidence()ShaferShenoyLIMIDInference.nbrSoftEvidence()ShaferShenoyLIMIDInference.optimalDecision()ShaferShenoyLIMIDInference.posterior()ShaferShenoyLIMIDInference.posteriorUtility()ShaferShenoyLIMIDInference.reducedGraph()ShaferShenoyLIMIDInference.reducedLIMID()ShaferShenoyLIMIDInference.reversePartialOrder()ShaferShenoyLIMIDInference.setEvidence()ShaferShenoyLIMIDInference.softEvidenceNodes()ShaferShenoyLIMIDInference.updateEvidence()