Sensitivity analysis for Bayesian networks using credal networks

Creative Commons License

aGrUM

interactive online version

There are several sensitivity analysis frameworks for Bayesian networks. A fairly efficient method is certainly to use credal networks to do this analysis.

Creating a Bayesian network

In [1]:
import pyagrum as gum
import pyagrum.lib.notebook as gnb
In [2]:
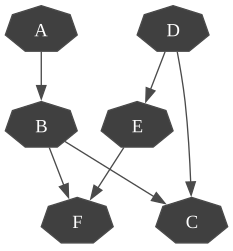
bn = gum.fastBN("A->B->C<-D->E->F<-B")
gnb.flow.row(bn, gnb.getInference(bn))
Out[2]:
G E E F F E->F D D D->E C C D->C A A B B A->B B->F B->C
structs Inference in   0.56ms A 2026-07-16T18:15:09.119546 image/svg+xml Matplotlib v3.11.0, https://matplotlib.org/ B 2026-07-16T18:15:09.140578 image/svg+xml Matplotlib v3.11.0, https://matplotlib.org/ A->B C 2026-07-16T18:15:09.166276 image/svg+xml Matplotlib v3.11.0, https://matplotlib.org/ B->C F 2026-07-16T18:15:09.253739 image/svg+xml Matplotlib v3.11.0, https://matplotlib.org/ B->F D 2026-07-16T18:15:09.190012 image/svg+xml Matplotlib v3.11.0, https://matplotlib.org/ D->C E 2026-07-16T18:15:09.219847 image/svg+xml Matplotlib v3.11.0, https://matplotlib.org/ D->E E->F

Building a credal network from a BN

It is easy to build a credal network from a Bayesian network by indicating the ‘noise’ on each parameter.

In [3]:
cr = gum.CredalNet(bn, bn)
gnb.show(cr)
../_images/notebooks_14-Examples_SensitivityAnalysisUsingCredalNetworks_6_0.svg
In [4]:
cr.bnToCredal(1e-10, False, False)
In [5]:
cr.computeBinaryCPTMinMax()
In [6]:
print(cr)

A:Range([0,1])
<> : [[0.34704 , 0.65296] , [0.0358161 , 0.964184]]

B:Range([0,1])
<A:0> : [[0.400207 , 0.599793] , [0.399775 , 0.600225]]
<A:1> : [[0.205351 , 0.794649] , [0.0845036 , 0.915496]]

C:Range([0,1])
<B:0|D:0> : [[0.188767 , 0.811233] , [0.157735 , 0.842265]]
<B:1|D:0> : [[0.406522 , 0.593478] , [0.406133 , 0.593867]]
<B:0|D:1> : [[0.929882 , 0.0701182] , [0.00022317 , 0.999777]]
<B:1|D:1> : [[0.279502 , 0.720498] , [0.275908 , 0.724092]]

D:Range([0,1])
<> : [[0.767496 , 0.232504] , [0.767494 , 0.232506]]

E:Range([0,1])
<D:0> : [[0.859877 , 0.140123]]
<D:1> : [[0.195555 , 0.804445] , [0.0936299 , 0.90637]]

F:Range([0,1])
<E:0|B:0> : [[0.764658 , 0.235342] , [0.764656 , 0.235344]]
<E:1|B:0> : [[0.451128 , 0.548872] , [0.450938 , 0.549062]]
<E:0|B:1> : [[0.529168 , 0.470832] , [0.529112 , 0.470888]]
<E:1|B:1> : [[0.836577 , 0.163422]]


Testing difference hypothesis about the global precision on the parameters

We can therefore easily conduct a sensitivity analysis based on an assumption of error on all the parameters of the network.

In [7]:
def showNoisy(bn, beta):
  cr = gum.CredalNet(bn, bn)
  cr.bnToCredal(beta, False, False)
  cr.computeBinaryCPTMinMax()
  ielbp = gum.CNLoopyPropagation(cr)
  return gnb.getInference(cr, engine=ielbp)
In [8]:
for eps in [1, 1e-1, 1e-2, 1e-3, 1e-10]:
  gnb.flow.add(showNoisy(bn, eps), caption=f"noise={eps}")
gnb.flow.display()
G E E F F E->F D D D->E C C D->C A A B B A->B B->F B->C
structs Inference in   0.56ms A 2026-07-16T18:15:09.119546 image/svg+xml Matplotlib v3.11.0, https://matplotlib.org/ B 2026-07-16T18:15:09.140578 image/svg+xml Matplotlib v3.11.0, https://matplotlib.org/ A->B C 2026-07-16T18:15:09.166276 image/svg+xml Matplotlib v3.11.0, https://matplotlib.org/ B->C F 2026-07-16T18:15:09.253739 image/svg+xml Matplotlib v3.11.0, https://matplotlib.org/ B->F D 2026-07-16T18:15:09.190012 image/svg+xml Matplotlib v3.11.0, https://matplotlib.org/ D->C E 2026-07-16T18:15:09.219847 image/svg+xml Matplotlib v3.11.0, https://matplotlib.org/ D->E E->F
structs Inference in   0.48ms A 2026-07-16T18:15:10.387062 image/svg+xml Matplotlib v3.11.0, https://matplotlib.org/ B 2026-07-16T18:15:10.428997 image/svg+xml Matplotlib v3.11.0, https://matplotlib.org/ A->B C 2026-07-16T18:15:10.459155 image/svg+xml Matplotlib v3.11.0, https://matplotlib.org/ B->C F 2026-07-16T18:15:10.560256 image/svg+xml Matplotlib v3.11.0, https://matplotlib.org/ B->F D 2026-07-16T18:15:10.494135 image/svg+xml Matplotlib v3.11.0, https://matplotlib.org/ D->C E 2026-07-16T18:15:10.531677 image/svg+xml Matplotlib v3.11.0, https://matplotlib.org/ D->E E->F
noise=1
structs Inference in   0.56ms A 2026-07-16T18:15:10.851903 image/svg+xml Matplotlib v3.11.0, https://matplotlib.org/ B 2026-07-16T18:15:10.894343 image/svg+xml Matplotlib v3.11.0, https://matplotlib.org/ A->B C 2026-07-16T18:15:10.934554 image/svg+xml Matplotlib v3.11.0, https://matplotlib.org/ B->C F 2026-07-16T18:15:11.044519 image/svg+xml Matplotlib v3.11.0, https://matplotlib.org/ B->F D 2026-07-16T18:15:10.973092 image/svg+xml Matplotlib v3.11.0, https://matplotlib.org/ D->C E 2026-07-16T18:15:11.008749 image/svg+xml Matplotlib v3.11.0, https://matplotlib.org/ D->E E->F
noise=0.1
structs Inference in   0.30ms A 2026-07-16T18:15:11.400339 image/svg+xml Matplotlib v3.11.0, https://matplotlib.org/ B 2026-07-16T18:15:11.430516 image/svg+xml Matplotlib v3.11.0, https://matplotlib.org/ A->B C 2026-07-16T18:15:11.461815 image/svg+xml Matplotlib v3.11.0, https://matplotlib.org/ B->C F 2026-07-16T18:15:11.603480 image/svg+xml Matplotlib v3.11.0, https://matplotlib.org/ B->F D 2026-07-16T18:15:11.501698 image/svg+xml Matplotlib v3.11.0, https://matplotlib.org/ D->C E 2026-07-16T18:15:11.543509 image/svg+xml Matplotlib v3.11.0, https://matplotlib.org/ D->E E->F
noise=0.01
structs Inference in   6.06ms A 2026-07-16T18:15:12.025558 image/svg+xml Matplotlib v3.11.0, https://matplotlib.org/ B 2026-07-16T18:15:12.060148 image/svg+xml Matplotlib v3.11.0, https://matplotlib.org/ A->B C 2026-07-16T18:15:12.093947 image/svg+xml Matplotlib v3.11.0, https://matplotlib.org/ B->C F 2026-07-16T18:15:12.208376 image/svg+xml Matplotlib v3.11.0, https://matplotlib.org/ B->F D 2026-07-16T18:15:12.121059 image/svg+xml Matplotlib v3.11.0, https://matplotlib.org/ D->C E 2026-07-16T18:15:12.170195 image/svg+xml Matplotlib v3.11.0, https://matplotlib.org/ D->E E->F
noise=0.001
structs Inference in  12.78ms A 2026-07-16T18:15:12.580178 image/svg+xml Matplotlib v3.11.0, https://matplotlib.org/ B 2026-07-16T18:15:12.614053 image/svg+xml Matplotlib v3.11.0, https://matplotlib.org/ A->B C 2026-07-16T18:15:12.645796 image/svg+xml Matplotlib v3.11.0, https://matplotlib.org/ B->C F 2026-07-16T18:15:12.781225 image/svg+xml Matplotlib v3.11.0, https://matplotlib.org/ B->F D 2026-07-16T18:15:12.691108 image/svg+xml Matplotlib v3.11.0, https://matplotlib.org/ D->C E 2026-07-16T18:15:12.728046 image/svg+xml Matplotlib v3.11.0, https://matplotlib.org/ D->E E->F
noise=1e-10
In [ ]: