Jupyter notebook with Graphical Models
pyagrum.lib.notebook aims to facilitate the use of pyAgrum with jupyter notebook (or lab).
Visualization of graphical models
Important
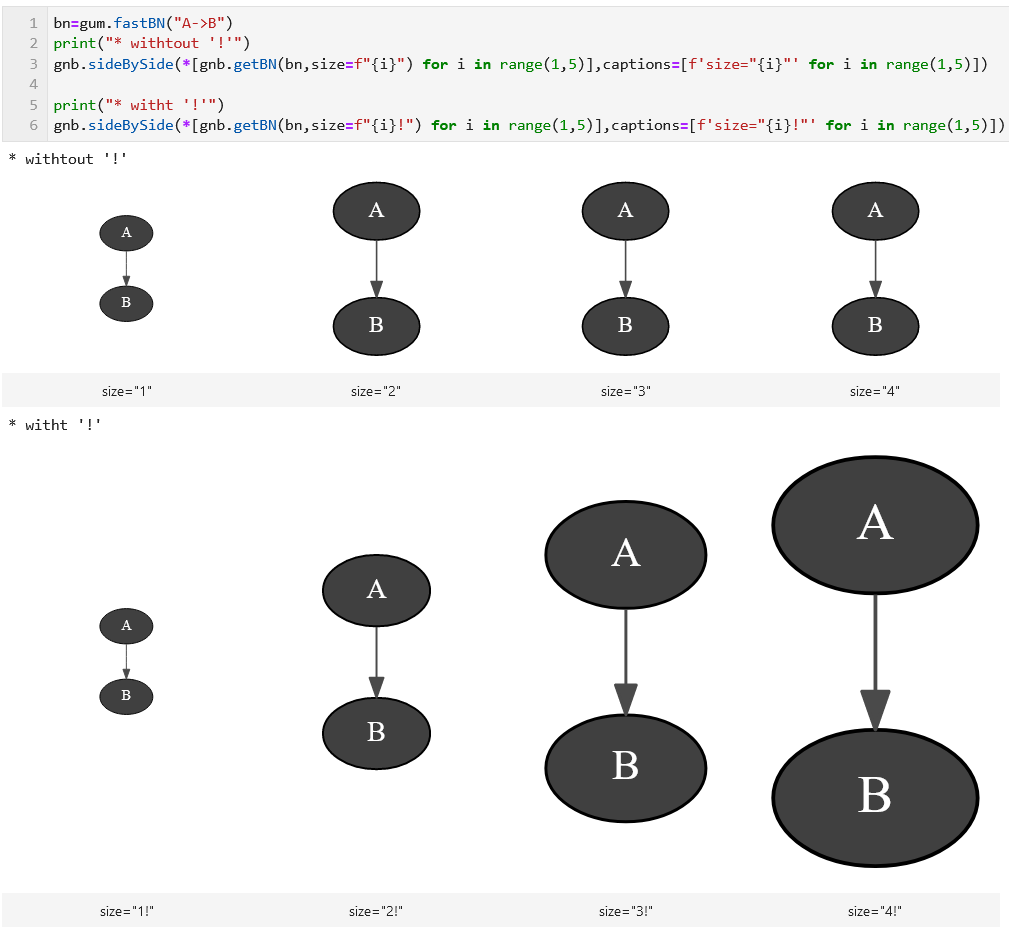
For many graphical representations functions, the parameter size is directly transferred to graphviz. Hence, Its format is a string containing an int. However if size ends in an exclamation point “!” (such as size=”4!”), then size is taken to be the desired minimum size. In this case, if both dimensions of the drawing are less than size, the drawing is scaled up uniformly until at least one dimension equals its dimension in size.
- pyagrum.lib.notebook.showBN(bn, size=None, nodeColor=None, arcWidth=None, arcLabel=None, arcColor=None, cmapNode=None, cmapArc=None)
show a Bayesian network
- Parameters:
bn (pyagrum.BayesNet) – the Bayesian network
size (str) – size (for graphviz) of the rendered graph
nodeColor (dict[Tuple(int,int),float]) – a nodeMap of values to be shown as color nodes (with special color for 0 and 1)
arcWidth (dict[Tuple(int,int),float]) – an arcMap of values to be shown as bold arcs
arcLabel (dict[Tuple(int,int),str]) – an arcMap of labels to be shown next to arcs
arcColor (dict[Tuple(int,int),float]) – an arcMap of values (between 0 and 1) to be shown as color of arcs
cmapNode (ColorMap) – color map to show the vals of Nodes ( (if cmapEdge is None, this color map is used also for edges)
cmapArc (ColorMap) – color map to show the vals of Arcs
showMsg (dict) – a nodeMap of values to be shown as tooltip
- Return type:
None
- pyagrum.lib.notebook.getBN(bn, size=None, nodeColor=None, arcWidth=None, arcLabel=None, arcColor=None, cmapNode=None, cmapArc=None)
get a HTML string for a Bayesian network
- Parameters:
bn (pyagrum.BayesNet) – the Bayesian network
size (str) – size (for graphviz) of the rendered graph
nodeColor (dict[Tuple(int,int),float]) – a nodeMap of values to be shown as color nodes (with special color for 0 and 1)
arcWidth (dict[Tuple(int,int),float]) – an arcMap of values to be shown as bold arcs
arcLabel (dict[Tuple(int,int),str]) – an arcMap of labels to be shown next to arcs
arcColor (dict[Tuple(int,int),float]) – an arcMap of values (between 0 and 1) to be shown as color of arcs
cmapNode (ColorMap) – color map to show the vals of Nodes
cmapArc (ColorMap) – color map to show the vals of Arcs
showMsg (dict) – a nodeMap of values to be shown as tooltip
- Returns:
the desired representation of the Bayesian network
- Return type:
pydot.Dot
- pyagrum.lib.notebook.showInfluenceDiagram(diag, size=None)
show an influence diagram as a graph
- Parameters:
diag (pyagrum.InfluenceDiagram) – the influence diagram
size (str) – size (for graphviz) of the rendered graph
- Return type:
None- Returns:
the representation of the influence diagram
- pyagrum.lib.notebook.getInfluenceDiagram(diag, size=None)
get a HTML string for an influence diagram as a graph
- Parameters:
diag (pyagrum.InfluenceDiagram) – the influence diagram
size (str) – size (for graphviz) of the rendered graph
- Returns:
the HTML representation of the influence diagram
- Return type:
str
- pyagrum.lib.notebook.showMRF(mrf, view=None, size=None, nodeColor=None, factorColor=None, edgeWidth=None, edgeColor=None, cmapNode=None, cmapEdge=None)
show a Markov random field
- Parameters:
mrf (pyagrum.MarkovRandomField) – the Markov random field
view (str) – ‘graph’ | ‘factorgraph’ | None (default)
size (str) – size (for graphviz) of the rendered graph
nodeColor (dict[int,float]) – a nodeMap of values (between 0 and 1) to be shown as color of nodes (with special colors for 0 and 1)
factorColor (dict[int,float]) – a function returning a value (between 0 and 1) to be shown as a color of factor. (used when view=’factorgraph’)
edgeWidth (dict[tuple[int,int],float]) – a edgeMap of values to be shown as width of edges (used when view=’graph’)
edgeColor (dict[int,float]) – a edgeMap of values (between 0 and 1) to be shown as color of edges (used when view=’graph’)
cmapNode (dict[tuple[int,int],float]) – color map to show the colors (if cmapEdge is None, this color map is used also for edges)
cmapEdge ("matplotlib.ColorMap") – color map to show the edge color if distinction is needed
- Return type:
None- Returns:
the graph
- pyagrum.lib.notebook.getMRF(mrf, view=None, size=None, nodeColor=None, factorColor=None, edgeWidth=None, edgeColor=None, cmapNode=None, cmapEdge=None)
get an HTML string for a Markov random field
- Parameters:
mrf (pyagrum.MarkovRandomField) – the Markov random field
view (str) – ‘graph’ | ‘factorgraph’ | None (default)
size (str) – size (for graphviz) of the rendered graph
nodeColor (dict[str,float]) – a nodeMap of values (between 0 and 1) to be shown as color of nodes (with special colors for 0 and 1)
factorColor (dict[str,float]) – a function returning a value (beeween 0 and 1) to be shown as a color of factor. (used when view=’factorgraph’)
edgeWidth (dict[tuple[str,str],float]) – a edgeMap of values to be shown as width of edges (used when view=’graph’)
edgeColor (dict[tuple[str,str],float]) – a edgeMap of values (between 0 and 1) to be shown as color of edges (used when view=’graph’)
cmapNode (matplotlib.ColorMap) – color map to show the colors (if cmapEdge is None, cmapNode is used for edges)
cmapEdge (matplotlib.ColorMap) – color map to show the edge color if distinction is needed
- Return type:
str- Returns:
the graph
- pyagrum.lib.notebook.showCN(cn, size=None, nodeColor=None, arcWidth=None, arcLabel=None, arcColor=None, cmapNode=None, cmapArc=None)
show a credal network
- Parameters:
cn (pyagrum.CredalNet) – the Credal network
size (str) – size (for graphviz) of the rendered graph
nodeColor (dict[int,float]) – a nodeMap of values to be shown as color nodes (with special color for 0 and 1)
arcWidth (dict[Tuple(int,int),float]) – an arcMap of values to be shown as bold arcs
arcLabel (dict[Tuple(int,int),float]) – an arcMap of labels to be shown next to arcs
arcColor (dict[Tuple(int,int),float]) – an arcMap of values (between 0 and 1) to be shown as color of arcs
cmapNode (matplotlib.color.colormap) – color map to show the vals of Nodes
cmapArc (matplotlib.color.colormap) – color map to show the vals of Arcs
showMsg (dict[int,str]) – a nodeMap of values to be shown as tooltip
- Return type:
None- Returns:
the graph
- pyagrum.lib.notebook.getCN(cn, size=None, nodeColor=None, arcWidth=None, arcLabel=None, arcColor=None, cmapNode=None, cmapArc=None)
get a HTML string for a credal network
- Parameters:
cn (pyagrum.CredalNet) – the Credal network
size (str) – size (for graphviz) of the rendered graph
nodeColor (dict[int,float]) – a nodeMap of values to be shown as color nodes (with special color for 0 and 1)
arcWidth (dict[Tuple(int,int),float]) – an arcMap of values to be shown as bold arcs
arcLabel (dict[Tuple(int,int),float]) – an arcMap of labels to be shown next to arcs
arcColor (dict[Tuple(int,int),float]) – an arcMap of values (between 0 and 1) to be shown as color of arcs
cmapNode (matplotlib.color.colormap) – color map to show the vals of Nodes
cmapArc (matplotlib.color.colormap) – color map to show the vals of Arcs
showMsg (dict[int,str]) – a nodeMap of values to be shown as tooltip
- Returns:
the desired representation of the Credal Network
- Return type:
pydot.Dot
- pyagrum.lib.notebook.showInference(model, **kwargs)
show pydot graph for an inference in a notebook
- Parameters:
model (pyagrum.GraphicalModel) – the model in which to infer (pyagrum.BayesNet, pyagrum.MarkovRandomField or pyagrum.InfluenceDiagram)
engine (pyagrum.BNInference | pyagrum.MRFInference | pyagrum.CNInference | pyagrum.IDInference) – inference algorithm used. If None, pyagrum.LazyPropagation will be used for BayesNet, pyagrum.ShaferShenoy for pyagrum.MarkovRandomField and pyagrum.ShaferShenoyLIMIDInference for pyagrum.InfluenceDiagram.
evs (dict[int|str,int|str|list[float]]) – map of evidence
targets (Set[str]) – set of targets
size (string) – size (for graphviz) of the rendered graph
nodeColor (dict[str,float]) – a nodeMap of values (between 0 and 1) to be shown as color of nodes (with special colors for 0 and 1)
factorColor (dict[int,float]) – a nodeMap of values (between 0 and 1) to be shown as color of factors (in MarkovRandomField representation)
arcWidth (: dict[(str,str),float]) – an arcMap of values to be shown as width of arcs
arcColor (: dict[(str,str),float]) – a arcMap of values (between 0 and 1) to be shown as color of arcs
cmapNode (matplotlib.ColorMap) – map to show the color of nodes and arcs
cmapArc (matplotlib.ColorMap) – color map to show the vals of Arcs.
graph (pyagrum.Graph) – only shows nodes that have their id in the graph (and not in the whole BN)
view (str) – graph | factorgraph | None (default) for Markov random field
- Return type:
None- Returns:
the desired representation of the inference
- pyagrum.lib.notebook.getInference(model, **kwargs)
get a HTML string for an inference in a notebook
- Parameters:
model (pyagrum.GraphicalModel) – the model in which to infer (pyagrum.BayesNet, pyagrum.MarkovRandomField or pyagrum.InfluenceDiagram)
engine (pyagrum.BNInference | pyagrum.MRFInference | pyagrum.CNInference | pyagrum.IDInference) – inference algorithm used. If None, pyagrum.LazyPropagation will be used for BayesNet, pyagrum.ShaferShenoy for pyagrum.MarkovRandomField and pyagrum.ShaferShenoyLIMIDInference for pyagrum.InfluenceDiagram.
evs (dict[int|str,int|str|list[float]]) – map of evidence
targets (Set[str]) – set of targets
size (string) – size (for graphviz) of the rendered graph
nodeColor (dict[str,float]) – a nodeMap of values (between 0 and 1) to be shown as color of nodes (with special colors for 0 and 1)
factorColor (dict[int,float]) – a nodeMap of values (between 0 and 1) to be shown as color of factors (in MarkovRandomField representation)
arcWidth (: dict[(str,str),float]) – an arcMap of values to be shown as width of arcs
arcColor (: dict[(str,str),float]) – a arcMap of values (between 0 and 1) to be shown as color of arcs
cmapNode (matplotlib.ColorMap) – map to show the color of nodes and arcs
cmapArc (matplotlib.ColorMap) – color map to show the vals of Arcs.
graph (pyagrum.Graph) – only shows nodes that have their id in the graph (and not in the whole BN)
view (str) – graph | factorgraph | None (default) for Markov random field
- Return type:
str- Returns:
the desired representation of the inference
- pyagrum.lib.notebook.showJunctionTree(bn, withNames=True, size=None)
Show a junction tree of a Bayesian network
- Parameters:
bn (pyagrum.BayesNet) – the model
withNames (bool) – names or id in the graph (names can created very large nodes)
size (float|str) – size (for graphviz) of the rendered graph
- Return type:
None
- pyagrum.lib.notebook.getJunctionTree(bn, withNames=True, size=None)
get a HTML string for a junction tree (more specifically a join tree)
- Parameters:
bn (pyagrum.BayesNet) – the Bayesian network
withNames (Boolean) – display the variable names or the node id in the clique
size (str) – size (for graphviz) of the rendered graph
- Return type:
str- Returns:
- str
the HTML representation of the graph
Visualization of Tensors
- pyagrum.lib.notebook.showProba(p, scale=None)
Show a mono-dim Tensor (a marginal)
- Parameters:
p (pyagrum.Tensor) – the marginal to show
scale (float) – the zoom factor
- Return type:
None
- pyagrum.lib.notebook.getPosterior(bn, evs, target)
shortcut for getProba(pyagrum.getPosterior(bn,evs,target))
- Parameters:
bn (pyagrum.BayesNet) – the BayesNet
evs (dict[str|int:int|str|list[float]]) – map of evidence
target (str|int) – name of target variable
- Return type:
str- Returns:
the HTML representation of the posterior
- pyagrum.lib.notebook.showPosterior(bn, evs, target)
shortcut for showProba(pyagrum.getPosterior(bn,evs,target))
- Parameters:
bn (pyagrum.BayesNet) – the BayesNet
evs (dict[str|int:int|str|list[float]]) – map of evidence
target (str|int) – name of target variable
- Return type:
None
- pyagrum.lib.notebook.getTensor(pot, digits=None, withColors=None, varnames=None)
return a HTML string of a pyagrum.Tensor as a HTML table. The first dimension is special (horizontal) due to the representation of conditional probability table
- Parameters:
pot (pyagrum.Tensor) – the tensor to show
digits (int) – number of digits to show
withColors (bool) – background for proba cells or not
varnames (list[str]) – the aliases for variables name in the table
- Returns:
the html representation of the Tensor (as a string)
- Return type:
str
- pyagrum.lib.notebook.showTensor(pot, digits=None, withColors=None, varnames=None)
show a pyagrum.Tensor as a HTML table. The first dimension is special (horizontal) due to the representation of conditional probability table
- Parameters:
pot (pyagrum.Tensor) – the tensor to show
digits (int) – number of digits to show
withColors (bool) – background color for proba cells or not
varnames (list[str]) – the aliases for variables name in the table
- Return type:
None
Visualization of graphs
- pyagrum.lib.notebook.getDot(dotstring, size=None)
get an HTML representation of a dot string
- Parameters:
dotstring (str) – the dot string
size (float|str) – size (for graphviz) of the rendered graph
- Return type:
str- Returns:
the HTML representation of the dot string
- pyagrum.lib.notebook.showDot(dotstring, size=None)
show a dot string as a graph
- Parameters:
dotstring (str) – the dot string
size (float|str) – size (for graphviz) of the rendered graph
- Return type:
None
- pyagrum.lib.notebook.getGraph(gr, size=None)
get an HTML representation of a pydot graph
- Parameters:
gr (pydot.Dot) – the graph
size (float|str) – the size (for graphviz) of the rendered graph
- Returns:
the HTML representation of the graph (as a string)
- Return type:
str
- pyagrum.lib.notebook.showGraph(gr, size=None)
show a pydot graph in a notebook
- Parameters:
gr (pydot.Dot) – the graph
size (float|str) – the size (for graphviz) of the rendered graph
- Return type:
None
Visualization of approximation algorithm
- pyagrum.lib.notebook.animApproximationScheme(apsc, scale=<ufunc 'log10'>)
show an animated version of an approximation algorithm
- Parameters:
apsc (
ApproximationScheme) – the approximation algorithmscale – a function to apply to the figure
- Return type:
None
Helpers
- pyagrum.lib.notebook.configuration()
Display the collection of dependance and versions
- Return type:
None
- pyagrum.lib.notebook.sideBySide(*args, **kwargs)
display side by side args as HMTL fragment (using string, _repr_html_() or str())
- Parameters:
args (str) – HMTL fragments as string arg, arg._repr_html_() or str(arg)
captions (list[str], optional) – list of captions
valign (str) – vertical position in the row (top|middle|bottom, middle by default)
ncols (int) – number of columns (infinite by default)
- Return type:
None